Using SAS is amazing. I did my first analytics project using SAS, and would like to share with newbies if it can help others. In my analytics project utilizing SAS, I employed a systematic approach to explore and analyze structured data. Beginning with the table creation with INPUT statement, I easily created my dataset. Leveraging PROC PRINT, I gained a comprehensive overview of the dataset’s structure, identifying key variables and initial patterns.
To enhance data organization, PROC SORT played a pivotal role, arranging the dataset based on specified variables. This step not only facilitated a clearer understanding of the data but also set the stage for subsequent analyses. By applying PROC MEAN, I look into statistical summaries, extracting crucial insights into variations within the dataset.
Further enriching my analysis, PROC FREQ provided a detailed examination of categorical variables, shedding light on distribution patterns and enabling me to identify noteworthy trends. In concert, these SAS procedures empowered a strong exploration of my analytics project, ensuring good data understanding.
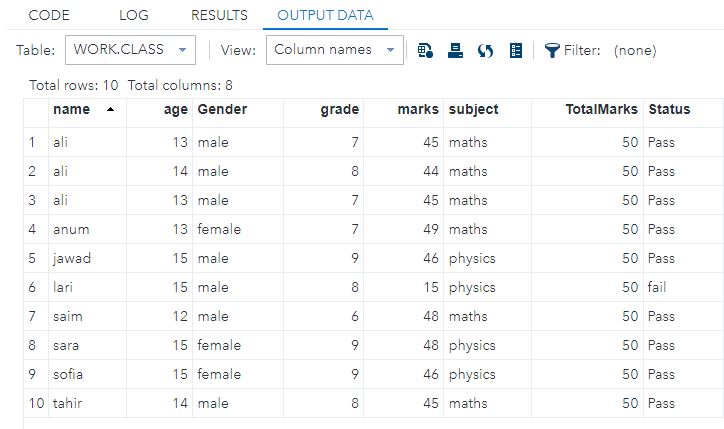
Creating a Data Set Table
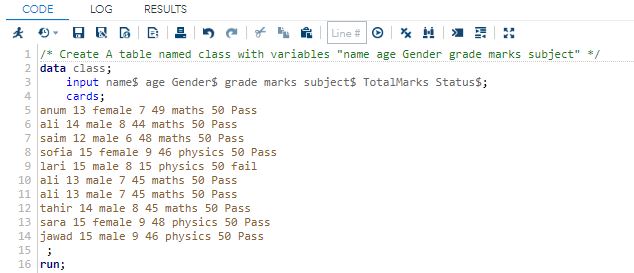
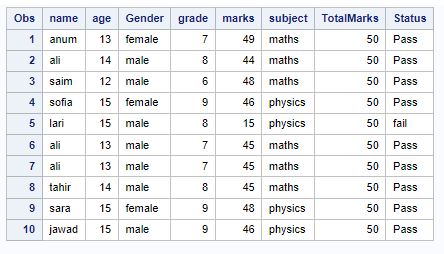
/* Create A table named class with variables “name age Gender grade marks subject” */
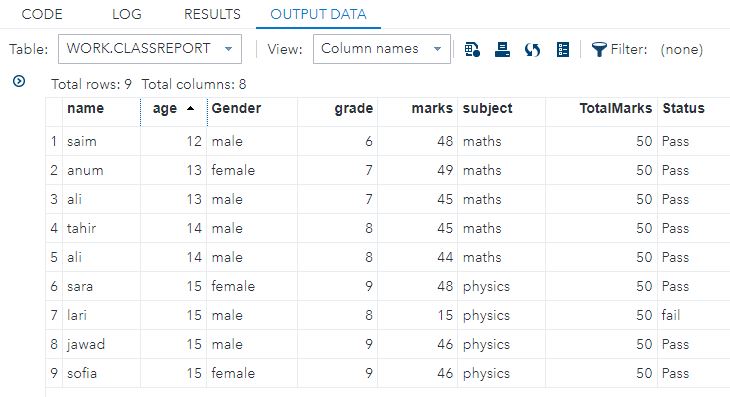
data class;
input name$ age Gender$ grade marks subject$ TotalMarks Status$;
cards;
anum 13 female 7 49 maths 50 Pass
ali 14 male 8 44 maths 50 Pass
saim 12 male 6 48 maths 50 Pass
sofia 15 female 9 46 physics 50 Pass
lari 15 male 8 15 physics 50 fail
ali 13 male 7 45 maths 50 Pass
ali 13 male 7 45 maths 50 Pass
tahir 14 male 8 45 maths 50 Pass
sara 15 female 9 48 physics 50 Pass
jawad 15 male 9 46 physics 50 Pass
;
run;
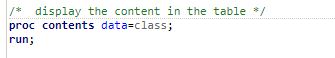
Proc Contents
/* display the content in the table */
proc contents data=class;
run;
Proc Print
/* Print the data set class */
proc print data=class;
run;
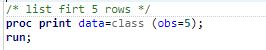
/* list first 5 rows */
proc print data=class (obs=5);
run;
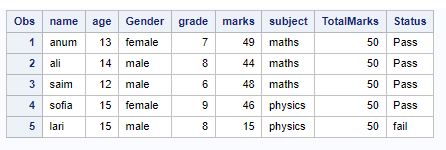
/* filtering rows with Basic Operators */
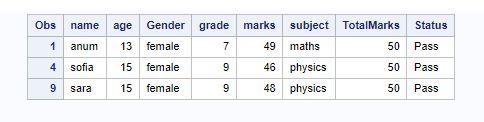
proc print data=class;
WHERE Gender=’female’;
run;
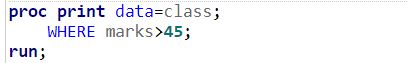
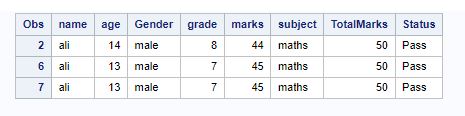
proc print data=class;
WHERE marks>45;
run;
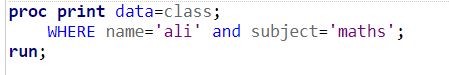
proc print data=class;
WHERE name=’ali’ and subject=’maths’;
run;
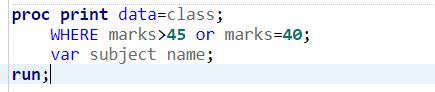
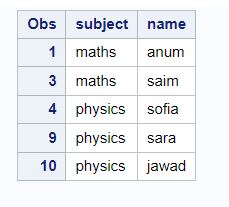
proc print data=class;
WHERE marks>40 or marks=40;
var subject=maths;
run;
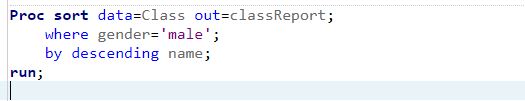
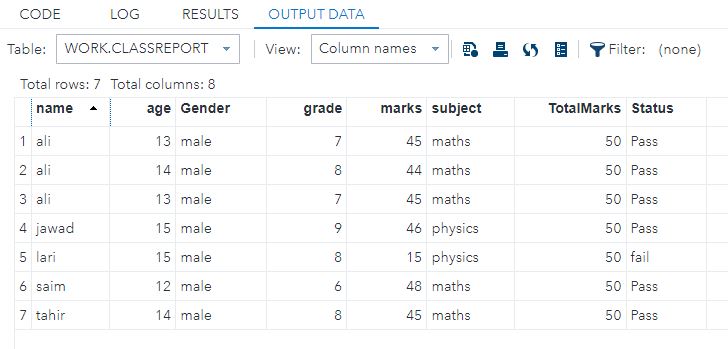
Proc Sort
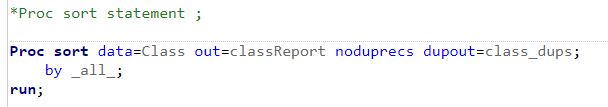
*Proc sort statement ;
Proc sort data=Class out=classReport noduprecs dupout=class_dups;
by _all_;
run;
Proc sort data=Class out=classReport;
where gender=’male’;
by descending name;
run;
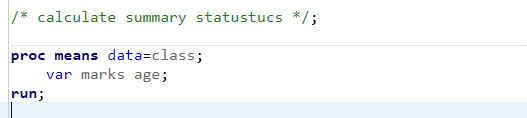
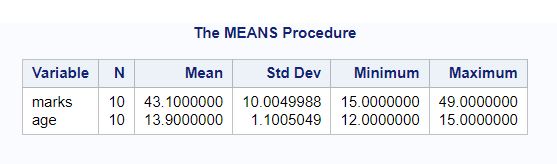
Proc Means
/* calculate summary statustucs */;
proc means data=class;
var marks age;
run;
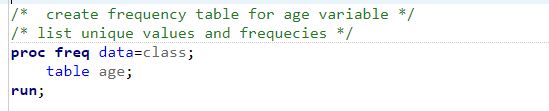
Proc Freq
/* create frequency table for age variable */
/* list unique values and frequecies */
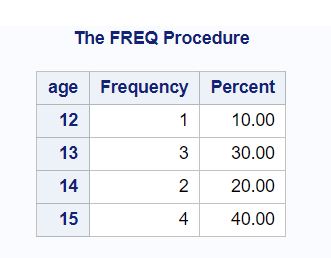
proc freq data=class;
table age;
run;
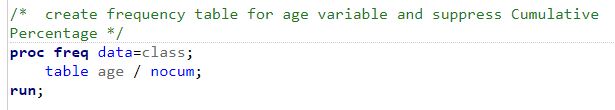
/* create frequency table for age variable and suppress Cumulative
Percentage */
proc freq data=class;
table age / nocum;
run;
/* create frequency table for marks variable and suppress percentages */
proc freq data=class;
tables marks / nopercent nocum;
run;
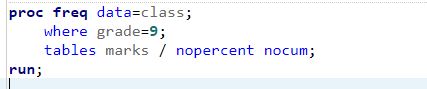
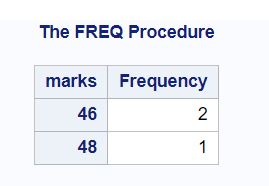
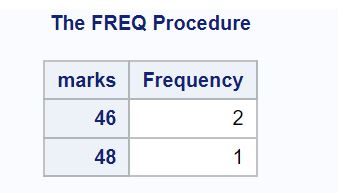
proc freq data=class;
where grade=9;
tables marks / nopercent nocum;
run;
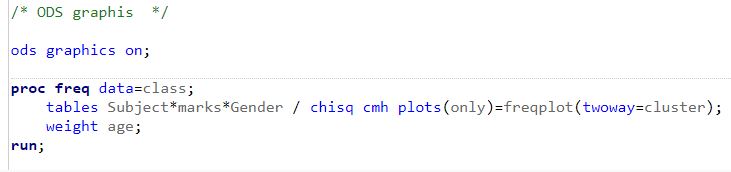
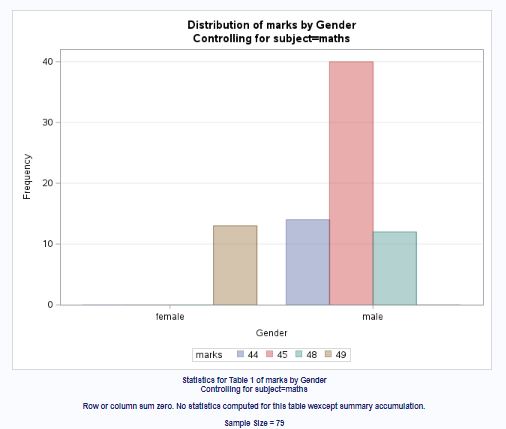
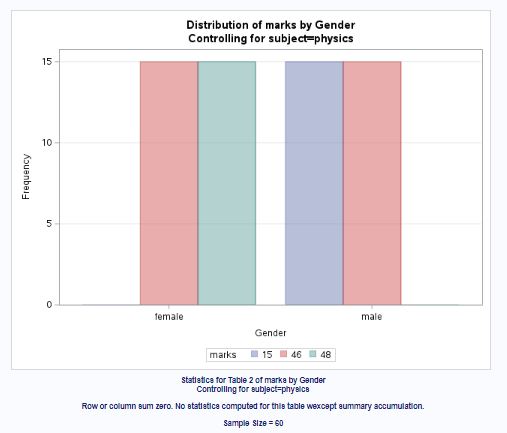
ODS Graphics On
ods graphics on;
proc freq data=class;
tables Subject*marks*Gender / chisq cmh plots(only)=freqplot(twoway=cluster);
weight age;
run;
ods graphics off;