
Data analysis is the backbone of modern decision-making. In 2025, as businesses compete in a fast-paced digital economy, understanding data is no longer optional—it’s essential. Whether you’re a beginner, a business analyst, or a manager, using the core data analysis techniques and tools can elevate your strategy and outcomes.
In this article, we’ll explore the top 5 data analysis techniques you should know in 2025. We’ll also highlight the importance of popular tools like Excel, Power BI, and Tableau, and examine how these techniques influence key business decisions. This guide is designed to help you make better, faster, and smarter decisions using data.
Why Data Analysis Matters More Than Ever in 2025
Businesses generate more data than ever before—from customer behavior and sales trends to financial forecasts and supply chain logistics. However, raw data alone is not useful. The real value lies in interpreting and analyzing data effectively to make actionable decisions.
The rise of self-service BI tools, AI-powered analytics, and data democratization has made data analysis more accessible. Still, choosing the right technique matters. The wrong approach can mislead strategy, while the right one can unlock powerful insights.
Connect on LinkedIn to Learn Data Analytics with Me !
The Top 5 Data Analysis Techniques in 2025
Let’s break down the five most impactful data analysis methods, how they work, and when to use them.
1. Descriptive Analysis
What it is: Descriptive analysis summarizes past data to identify trends and patterns. It answers the question: What happened?
Tools used:
- Excel: Ideal for basic summaries, pivot tables, and charts.
- Power BI: Offers dynamic dashboards and interactive visuals.
- Tableau: Excels at data visualization and storytelling.
Use cases:
- Sales reports by quarter
- Website traffic summaries
- Customer demographics
Why it matters in 2025: With increasing data availability, descriptive analytics provides a baseline for comparing new performance metrics against past results.
2. Diagnostic Analysis
What it is: Diagnostic analysis dives deeper to explain why something happened. It involves identifying correlations, anomalies, and root causes.
Tools used:
- Excel (with add-ins): Allows regression analysis and advanced formulas.
- Power BI with DAX: Helps build calculated measures and insights.
- Python/R: Used for custom statistical models.
Use cases:
- Why did sales drop last month?
- Which marketing campaign underperformed?
- Why are customer returns spiking?
Why it matters in 2025: In a competitive market, understanding the “why” behind trends helps companies fix issues quickly and optimize performance.
3. Predictive Analysis
What it is: Predictive analytics uses historical data to forecast future outcomes using statistical models and machine learning.
Tools used:
- Excel with Forecast Sheet or Solver
- Power BI with Azure Machine Learning integration
- Tableau with R or Python scripts
Use cases:
- Sales forecasts
- Inventory planning
- Customer churn prediction
Why it matters in 2025: With AI more deeply integrated into tools, predictive analysis gives businesses a competitive edge by anticipating future needs.
4. Prescriptive Analysis
What it is: This technique recommends actions to take for optimal outcomes. It often uses optimization algorithms and simulation.
Tools used:
- Power BI with Power Automate
- Excel Solver for decision modeling
- Cloud-based platforms like Google Cloud AI or IBM Watson
Use cases:
- Pricing strategy models
- Supply chain route optimization
- Resource allocation plans
Why it matters in 2025: It turns insights into action. Prescriptive analytics closes the loop between data and strategic execution.
5. Exploratory Data Analysis (EDA)
What it is: EDA is the process of analyzing datasets to summarize their main characteristics, often using visual methods. It’s useful when you don’t yet know what to look for.
Tools used:
- Tableau for interactive discovery
- Python (Pandas, Seaborn) for flexible, code-driven analysis
- Power BI Q&A and natural language querying
Use cases:
- Early-stage research
- Data quality assessment
- Discovering unexpected patterns
Why it matters in 2025: EDA is essential for innovation. It enables creativity, exploration, and the discovery of hidden opportunities in the data.
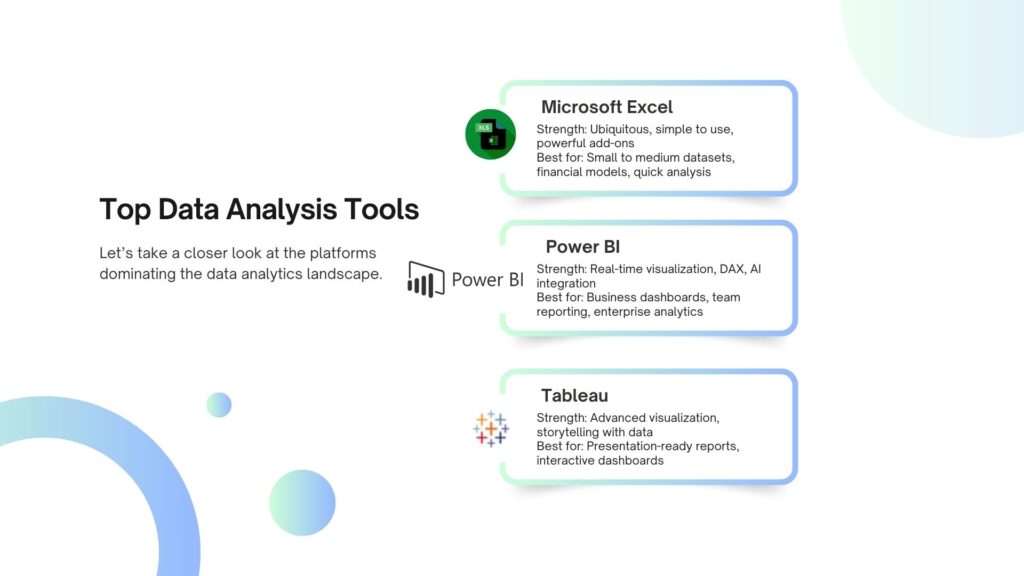
Most Important Data Analysis Tools in 2025
Let’s take a closer look at the platforms dominating the data analytics landscape.
🔹 Microsoft Excel
Still one of the most used tools globally. With advanced features like Power Query, Pivot Tables, and the Forecast Sheet, Excel supports both beginner and advanced analyses.
🔹 Power BI
Microsoft’s business analytics service integrates seamlessly with Excel, Azure, and cloud platforms. It’s excellent for real-time dashboards, sharing insights, and using natural language to ask questions.
🔹 Tableau
Known for its stunning visualizations and drag-and-drop interface. Tableau integrates well with cloud services and offers advanced data blending and storytelling capabilities.
Key Considerations When Choosing a Data Analysis Technique
When deciding which data analysis technique to use, consider the following:
✅ Objective of Your Analysis
Are you trying to summarize, diagnose, predict, prescribe, or explore? Choose your method based on your goal.
✅ Nature and Volume of Data
Large datasets might require machine learning tools and cloud platforms, while smaller sets can be handled in Excel or Power BI.
✅ Audience and Output Format
Will the results be shared with stakeholders? If so, tools like Tableau or Power BI can visualize the findings clearly.
✅ Scalability and Collaboration
In enterprise settings, choose tools that support team collaboration, real-time updates, and cloud access.
Get Your CV Ready for Free to Launch Your Data Analyst Career
Real-World Applications That Show the Power of These Techniques
- Retail Forecasting
A chain store used predictive analytics with Power BI to accurately forecast demand, reducing inventory waste by 25%. - Healthcare Diagnosis
Hospitals use diagnostic analytics to track readmission rates, identifying high-risk patients early. - Marketing Optimization
Companies leverage prescriptive models to optimize ad spend, increasing ROI by targeting the right channels. - Startup Product Development
Startups use EDA to explore customer usage data, discovering unmet needs and adapting product features quickly.
Conclusion: Choosing the Right Technique in 2025
Understanding and applying the right data analysis techniques in 2025 can define the success of your projects, strategies, and goals. Tools like Excel, Power BI, and Tableau make data more accessible, but the technique you use determines the insight you gain.
Whether you’re summarizing trends with descriptive analytics or exploring future possibilities with predictive models, always align your method with your decision-making needs. Embrace data literacy, ask the right questions, and let your insights guide impactful action.
Ready to take the next step?
Consider exploring free courses on Excel, Power BI, or Tableau to strengthen your data analysis skills. The future of business belongs to those who understand their data.
🗨️ What data analysis tool do you use the most, and why? Share your experience in the comments below.
Best Posts to Learn Data Analytics
- Top 5 Data Analysis Techniques You Need to Know in 2025
 Data analysis is the backbone of modern decision-making. In 2025,
 - How Data Analysis Can Improve Business Decisions in 2025?
 In today’s fast-paced and data-driven world, companies no longer make
 - Unlock Your Data Analyst Career with the Power of Self-Directed Learning
 Data Analyst Career opportunities are rapidly expanding in today’s data-driven
What are the top data analysis techniques in 2025?
In 2025, the most important data analysis techniques include:
Descriptive Analysis
Diagnostic Analysis
Predictive Analysis
Prescriptive Analysis
Exploratory Data Analysis (EDA)
These techniques help businesses understand past patterns, identify causes, predict future trends, and make better decisions.
Which tools are best for learning and applying data analysis techniques in 2025?
The top tools for data analysis in 2025 include:
Excel – for quick analysis and dashboards
Power BI – for real-time, interactive reporting
Tableau – for advanced data visualization
Python and R – for statistical and machine learning analysis
SQL – for querying and managing databases
These tools are used across industries for everything from beginner-level analysis to complex AI-driven insights.
Why is it important to choose the right data analysis technique?
Selecting the right technique ensures that:
Your insights are relevant and actionable
You don’t misinterpret data or draw false conclusions
You save time and resources by using the most efficient approach
Business decisions are based on accurate and meaningful trends
Different techniques answer different types of questions—so the impact of your analysis depends heavily on using the correct method.
Can beginners use these data analysis techniques and tools?
Yes! Many tools like Excel, Power BI, and Tableau are designed with user-friendly interfaces that allow beginners to perform powerful analyses without coding. Online courses, tutorials, and communities make it easier than ever to learn and apply these techniques effectively.
How are data analysis trends evolving in 2025?
Data analysis is shifting toward:
Automation and AI-driven analytics
Self-service BI tools like Power BI and Tableau
Real-time decision-making
A focus on data ethics and privacy
Increasing demand for data literacy across teams, not just analysts
Understanding these trends helps professionals and businesses stay ahead in a competitive, data-driven landscape.